


What is the average class size?
- The typical class size in US public schools is 16-23 students. In 2020-2021, the mean was 18.3, down from 19.6 in 2017-2018.
- The OECD average class size in primary education is about 20 students (stable since 2013). The EU average is slightly lower, at about 19 students.
- OECD average class size in lower secondary education is about 22 students.
- The OECD average student-teacher ratio in primary education is about 14:1 (2023).
- General trend: minor decline in class sizes across OECD countries since the early 2010s.
- Class size and student-teacher ratio are different measures.
Education statistics typically lag by 1-2 years or more and may not be collected every year, depending on the source. We will keep an eye on new data releases and update this article as new statistics become available.
How class size is measured
Class size refers to the average number of students per class. It is mainly measured at primary and lower secondary levels because, at higher levels, students are split into subject-specific groups, making it harder to define class size consistently.
Student-teacher ratio (STR) is a different metric: the total number of students divided by the total number of teachers at a given education level. A school with 100 students and 5 teachers has an STR of 20:1, but the actual class sizes depend on scheduling, subjects, teacher roles, and the number of teachers in a classroom. STR includes teachers who may not lead a classroom, such as specialists or part-time staff. Class size is what students and teachers actually experience day to day.
One subtlety worth knowing: the average class size is not the same as the class size experienced by the average student. Larger classes contain more students by definition, so the typical student sits in a somewhat larger class than the simple average suggests.
Classroom sizes in square feet or meters are a different topic and handled in a separate article.
Class size distribution in the US
To understand what lies behind the country’s averages in practice, we can examine the distribution of class sizes in US public schools. The histograms below are based on data from the National Center for Education Statistics (NCES).
In early 2026, the latest available NCES data is from 2020-2021. NCES does not collect this data every year.
The underlying data consists of state-level averages, broken down by school level (primary, middle, high), class type (self-contained, departmentalized), and public vs. private. In a self-contained class, the teacher teaches all subjects to the same group of students. This is common in primary schools. In a departmentalized class, the teacher teaches one subject to different groups of students, which is the norm in middle and high schools. We use only public school data for this section, combining primary and secondary levels and different class types to get a general picture of class-size distribution across US public schools.
The NCES source has flagged some state-average figures as unreliable. We have included these in the histograms, but the reader should note that the extreme values at the low and high ends may not be reliable.
Because the histograms are built on already-averaged state-level data, they may mask variation within states, districts, or individual schools. Importantly, the graphs treat all states equally, so small states with fewer schools have a relatively large weight in the graph. Similarly, large states with many schools get underrepresented. Still, the data provides a reasonable picture of how class sizes are distributed across the US.
The distributions roughly follow a normal (bell-shaped) distribution. The standard deviation is about 3 students, meaning that roughly 68% of class sizes fall within 3 students of the average. If the average is 20, most classes have between 17 and 23 students.
Planning for various class sizes can be challenging. To plan, manage, and visualize seating arrangements, consider using a seating chart maker that simplifies the process.
2017-2018
In 2017-2018, the most common class size in US public schools was 22 students. The majority of class sizes ranged from 15 to 26 students. The histogram is slightly left-skewed, with a higher frequency of classes in the 15-22 range than in the 22-26 range. The mean class size was 19.6 students.
Class sizes in US public schools: 2017-2018
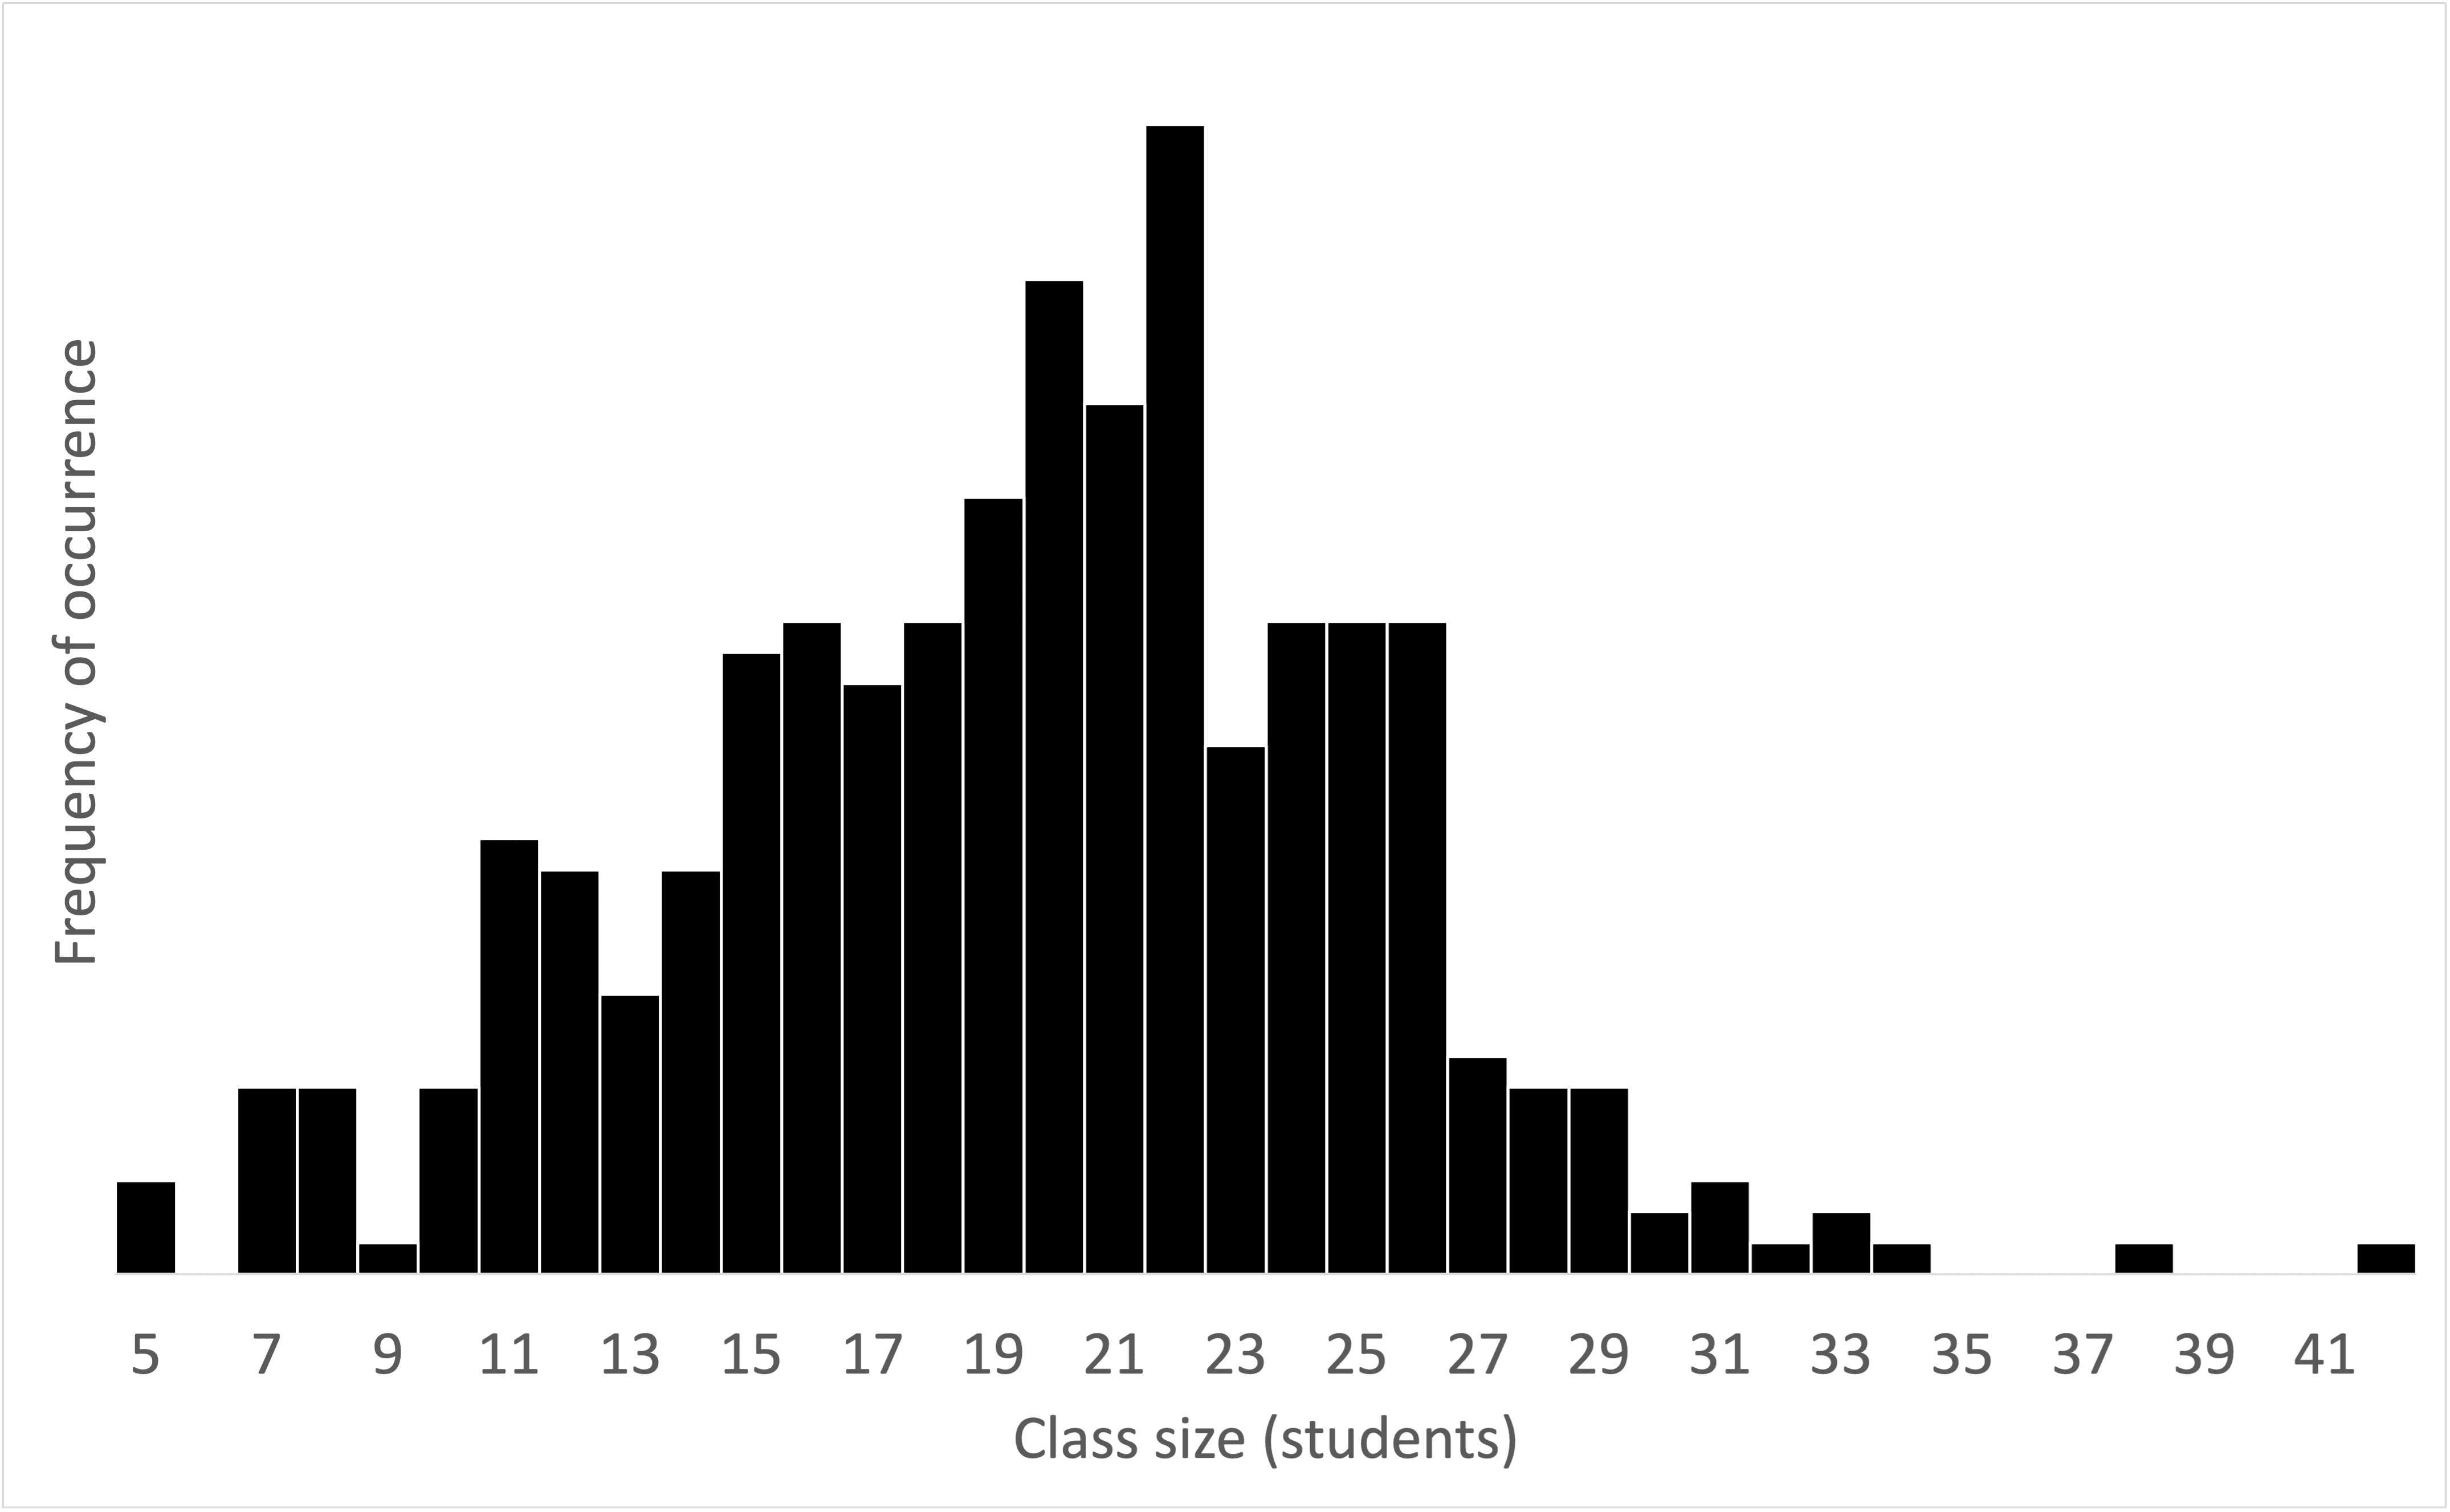
On the extremes, state-level averages ranged from 5 to 42 students. Since these are averages across all classes in a state for a given class type and school level, individual classrooms are likely to fall outside this range at both ends.
2020-2021
In 2020-2021, the most common class size was 19 students, and most class sizes ranged from 15 to 23 students. The mean was 18.3 students.
Class sizes in US public schools: 2020-2021
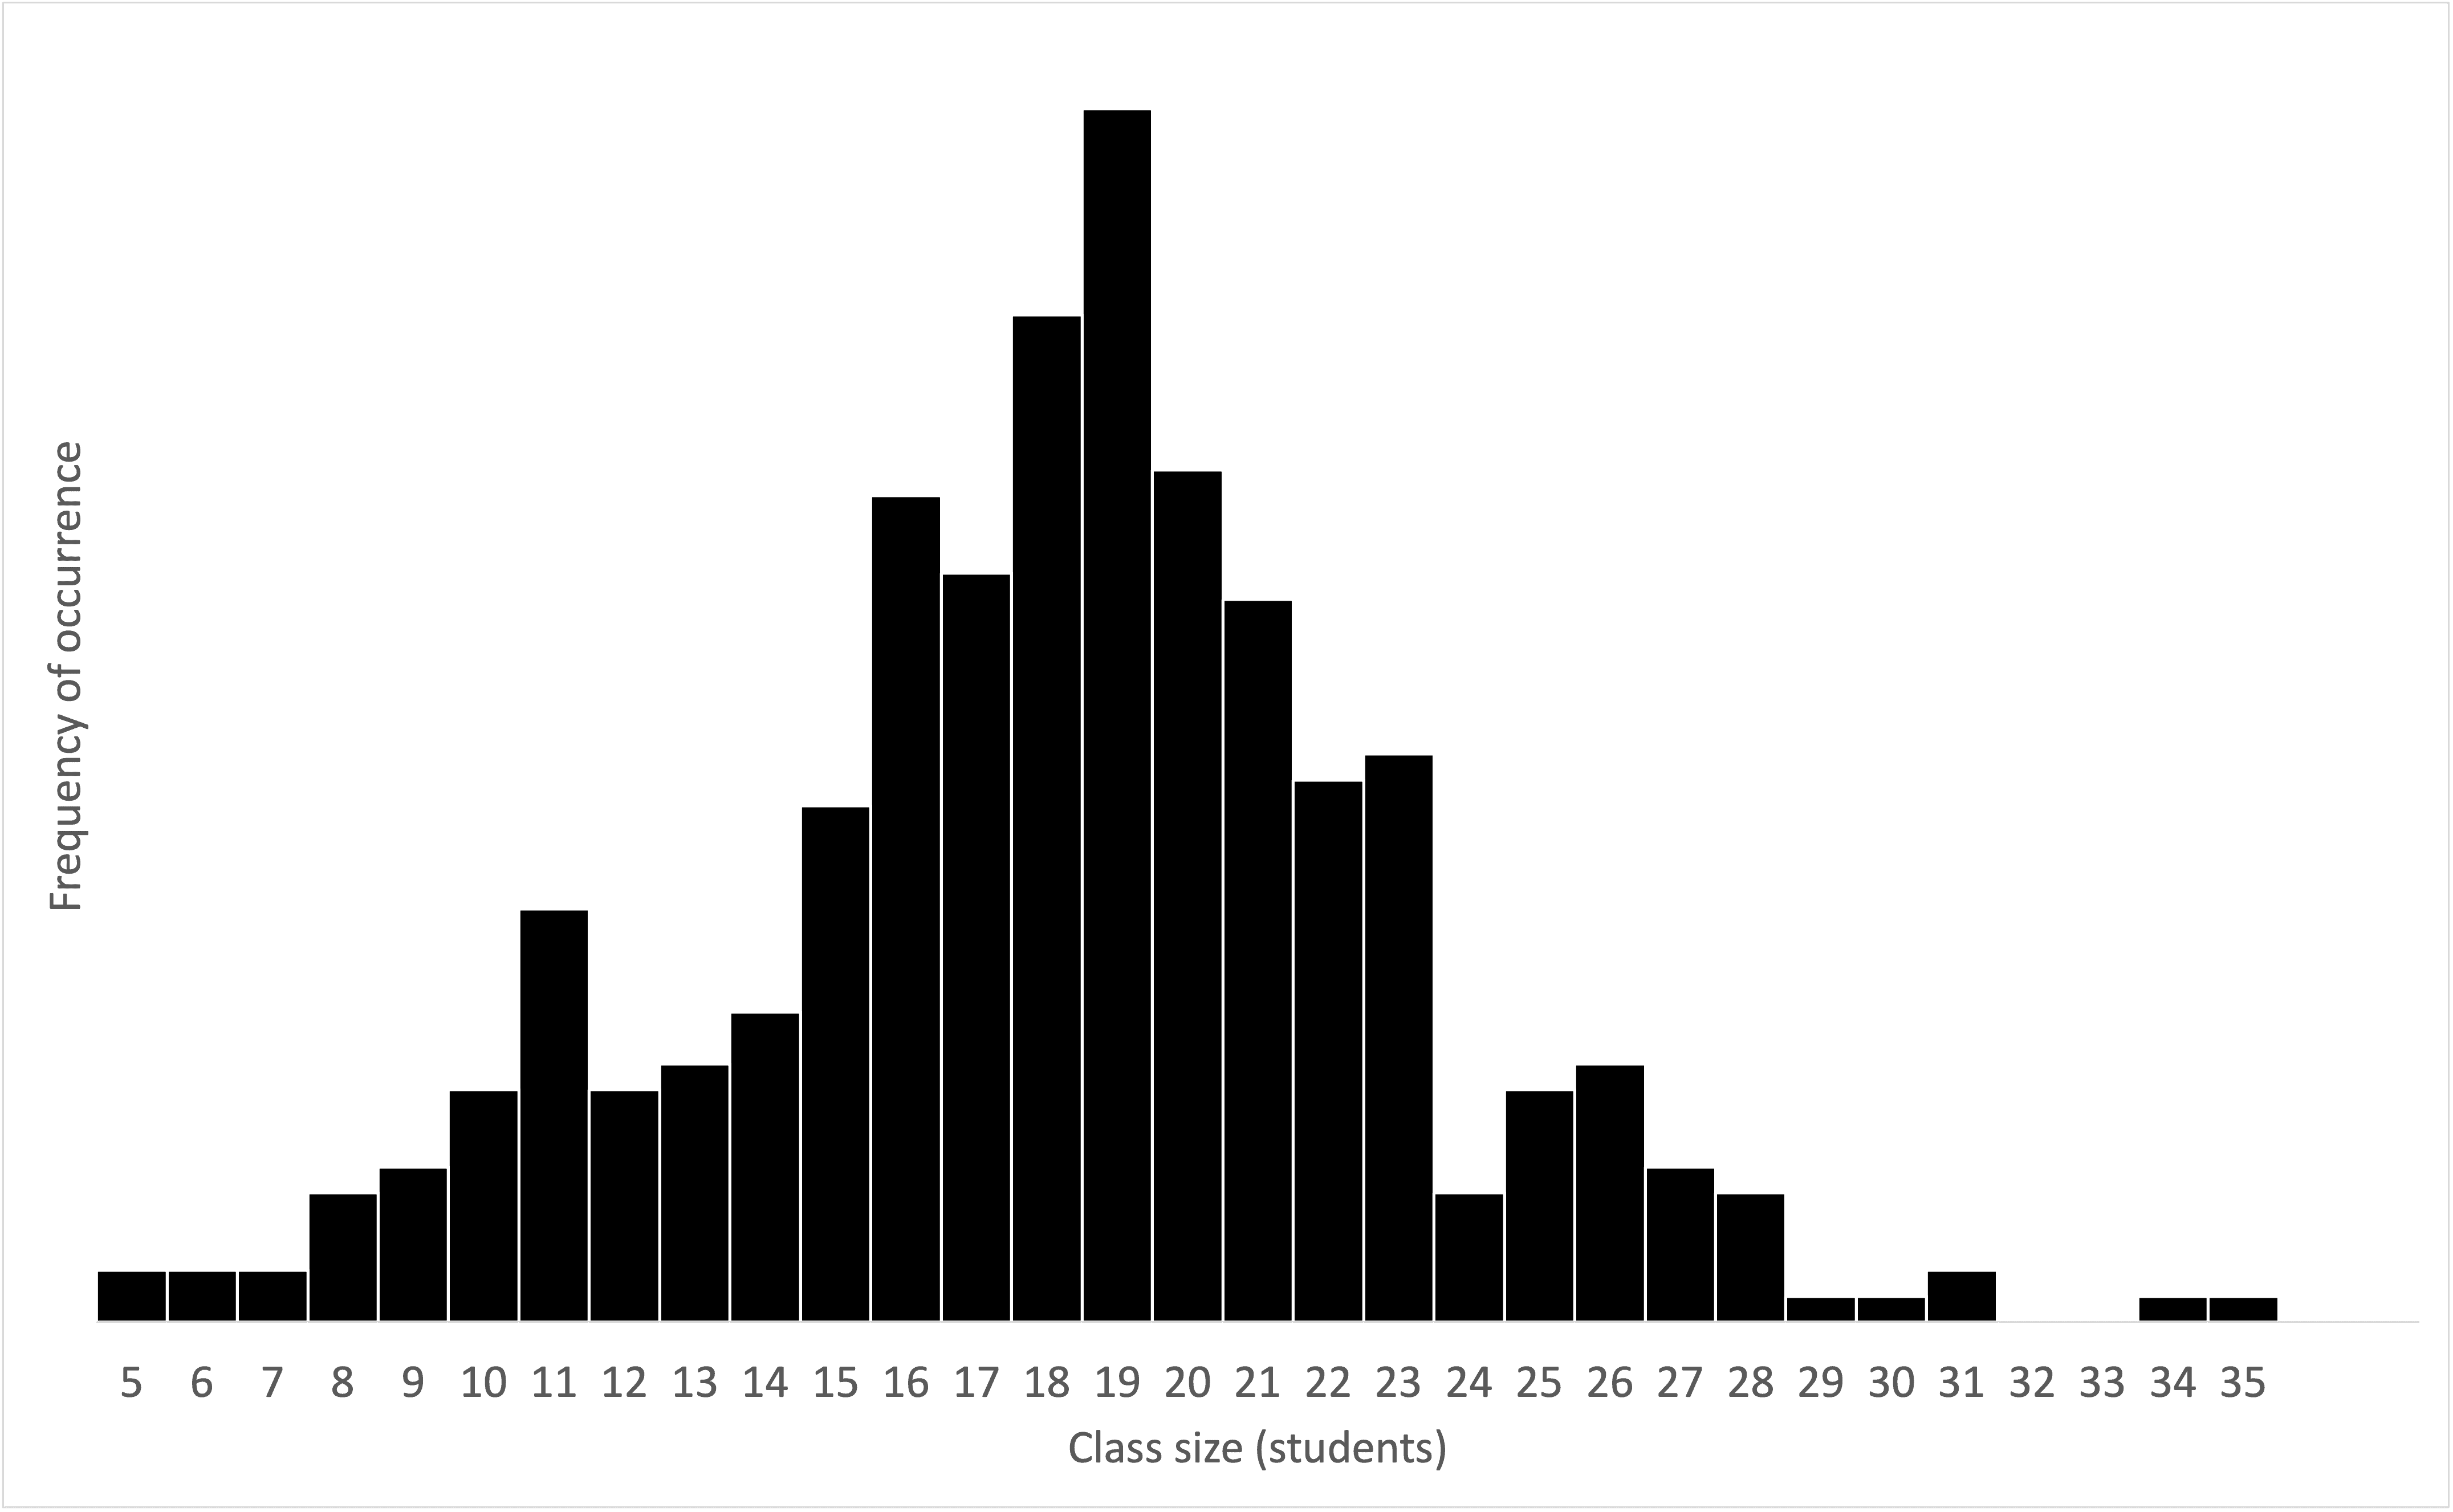
The 2020-2021 histogram appears symmetric with no visible skew. There is a noticeable drop-off in frequency after a class size of 23, unlike the 2017-2018 data. A spike at 11 students stands out, possibly reflecting class size policies in certain states. There are also fewer state averages at 30 or more compared to 2017-2018.
Comparison: 2017-2018 vs. 2020-2021
The mean class size dropped from 19.6 to 18.3, a decline of 1.3 students. The 2020-2021 distribution is slightly tighter, with fewer extreme values at the high end.
COVID-19 likely played a role. The 2020-2021 school year was already heavily affected by the pandemic, and the lower averages may reflect temporary adjustments, such as reduced cohorts and hybrid learning, rather than a lasting structural change. The OECD trend data later in this article provides a longer-term view.
Class size trends across OECD countries
The OECD publishes class-size data for its member countries as part of its annual Education at a Glance report. The OECD data is available at OECD Data Explorer. Older (pre-2013) OECD data is available in OECD Data Explorer Archive. The data covers both public and private institutions. Note that the US histogram data above covers only public schools, so the OECD figures for the US may differ slightly. The OECD 2025 report, the latest available source for this article (updated early 2026), covers data up to 2022 or 2023, depending on the country and metric.
The data used in the charts below covers primary and lower secondary education separately. Primary education refers to the first stage of formal education, typically covering ages 6-11 (in the US system, roughly grades 1-5 or 1-6). Lower secondary education covers roughly ages 12-15 (grades 6-8 or 7-9, often called “middle school” in the US).
One note on the EU average: in the OECD data, the EU average before 2013 is based on 22 member states, while 2013 onward uses 25 member states. This is a symptom of combining two separate OECD data sets to see a longer-term trend. This causes a discontinuity in the EU line on the charts around 2013.
Primary education
In the 2022 data (latest year with an OECD average available), the OECD average primary class size was 19.9 students. The EU average was 18.8 students. The US sat at 20.1. The OECD average has been stable at around 20-21 students since 2005. The EU average has been consistently below the OECD average. The US closely tracks the OECD average over the years.
Primary education class size trends (2005-2023) for selected countries

Several countries stand out. South Korea saw a large decline, from 33 students per class in 2005 to 22 in 2022. Brazil also declined, from 25 in 2005 to 20 in 2022. On the other hand, the UK and Mexico are above the OECD average and have seen increases in recent years, bucking the general downward trend. The UK went from 24 in 2005 to 26 in 2022, and Mexico from 20 to 24. Lithuania is interesting as an outlier with small class sizes (15 in 2005), although it has been trending upward to 18 in 2022.
Chile and Israel consistently have among the largest class sizes in the OECD, with about 31 and 26 students, respectively, in 2022. Japan (not in the graph) also stays high at 27.
Many European countries (including France, Germany, Italy, Spain, and most Nordic countries) have class sizes close to the OECD average and are omitted from the trend chart to keep it readable.
Primary education class size by country (2022)

The bar chart shows how the 2022 data varies across individual countries. Chile (31.0), Japan (27.0), and Israel (26.1) are at the top. Costa Rica (15.2), Luxembourg (15.6), and Greece (17.0) have the smallest primary classes.
Lower secondary education
Class sizes in lower secondary education tend to be somewhat larger than in primary. In 2022, the OECD average was 22.1 students, compared to 19.9 in primary. The EU average was 20.7 students, and the US average was 21.2 students.
Lower secondary education class size trends (2005-2023) for selected countries

The trends in lower secondary education broadly mirror those in primary education. South Korea declined from 36 in 2005 to 26 in 2022. Poland also saw a large drop, from 24 to 18. The US dropped from 26 in 2005 to 21 in 2022, a bigger change than in primary education. Brazil’s lower secondary classes went from 32 in 2005 to 26 in 2022.
Japan (not in the graph) has the highest lower secondary class sizes in the data at about 32 students, and this has barely changed over the full time period. Chile and Israel remain high at 32 and 28, respectively.
Costa Rica (not in the graph) is interesting: it jumped from 27 in 2015 to 33 in 2016 and has stayed high since, though it dropped to 30 in 2022. Mexico, on the other hand, declined from 30 in 2005 to 26 in 2022.
Lower secondary class size by country (2022)

Japan (31.9), Chile (31.6), and Costa Rica (29.9) have the largest lower secondary classes. Latvia (17.6), Poland (18.0), and Luxembourg (18.3) have the smallest.
Public vs. private school class sizes
The above graphs combine public and private school data. If we look at public and private data from the source separately, we see that, roughly, class sizes in both public and private primary schools remained stable across OECD countries between 2013 and 2023. In lower secondary education, public school class sizes changed little, while private institutions saw a slight decrease. In pre-primary education, public institutions have slightly higher child-to-teacher ratios (about 15:1) than private institutions (about 13:1). These are OECD-wide averages, and the variation between countries is substantial.
Limitations and methodology notes
- Data lag. Education statistics are typically published 1-2 years after the school year they cover. The OECD 2025 report covers data up to 2022 or 2023, depending on the country.
- Primary vs. secondary. Most of the class-size data presented here cover primary and lower secondary education. Numbers at the upper secondary level may differ. OECD data shows secondary STR is slightly lower on average (13:1 vs. 14:1 for primary), but this varies by country.
- Class size is not student-teacher ratio. STR includes non-classroom teachers. A country can have a low STR but still have large classes if many teachers hold non-teaching roles.
- Public and private. The OECD trend data includes both public and private institutions. The US histogram data covers only public schools.
- Averages hide variation. National averages mask significant differences across states and regions, urban and rural areas, public and private schools, and subject areas. A country with an average of 21 may have classes ranging from 10 to 35, depending on context.
- COVID-19 effects. Data from 2020-2022 may reflect temporary pandemic measures (reduced cohorts, hybrid learning, incomplete data reporting) rather than lasting structural changes.
Conclusion
Average class sizes in primary education have been stable across OECD countries over the past decade, at about 20-21 students per class. The US tracks close to this average. The EU average is about 1 student lower. Lower secondary classes are somewhat larger, averaging about 22 students.
The variation between countries is large. Chile, Japan, and Israel consistently have class sizes well above the OECD average, while smaller classes are found in countries like Latvia, Greece, and Luxembourg.
It is not clear whether smaller class sizes always lead to better outcomes. Research on the topic is mixed, and the optimal size likely depends on many factors, including teaching quality, resources, and student needs. This article focuses on reporting the data rather than making policy recommendations.
Sources
- National Center for Education Statistics (NCES), National Teacher and Principal Survey (NTPS), Tables. nces.ed.gov
- OECD (2025), Education at a Glance 2025: OECD Indicators, Chapter D2. oecd.org
- OECD Data Explorer, Education database, class size, and student/teacher ratio indicators. date-explorer.oecd.org
- OECD Data Explorer - Archive, Education database, class size, and student/teacher ratio indicators. stats.oecd.org


